Real-Time Data Streaming and Visualization Project
This project demonstrates a real-time data streaming pipeline that collects sensor data from an OPC-UA server, stores it in InfluxDB3, and visualizes it in Grafana with alerting capabilities.
Problem
Real-time monitoring of industrial sensor data is critical for operational safety and efficiency. However, setting up a low-latency pipeline that can ingest, store, and visualize high-frequency data from protocols like OPC-UA is complex and requires integrating multiple specialized tools.
Solution
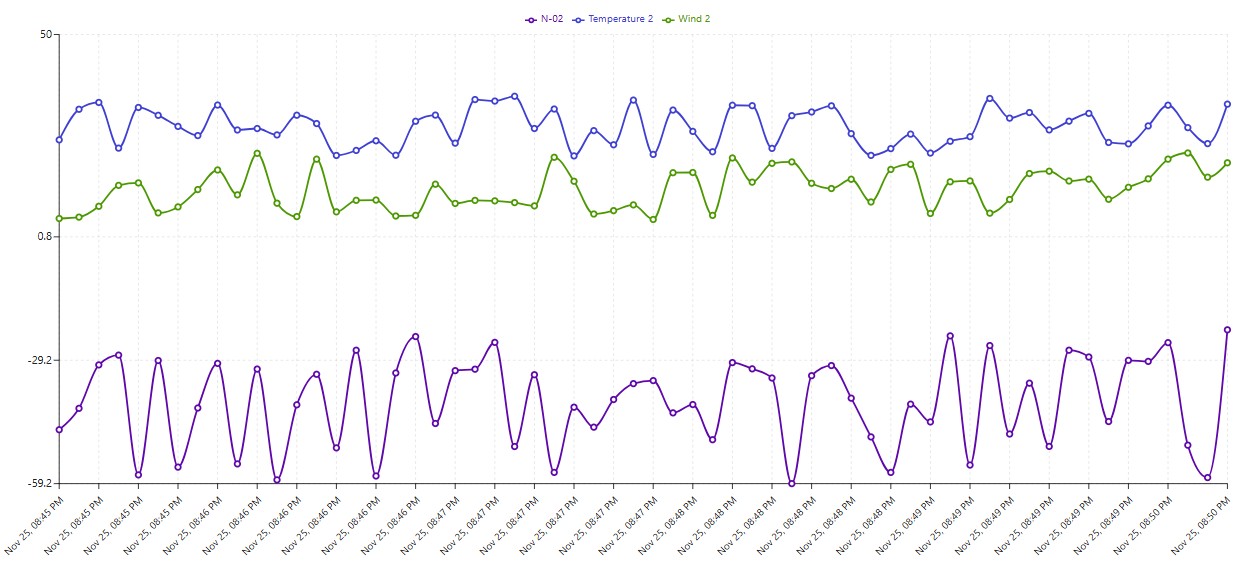
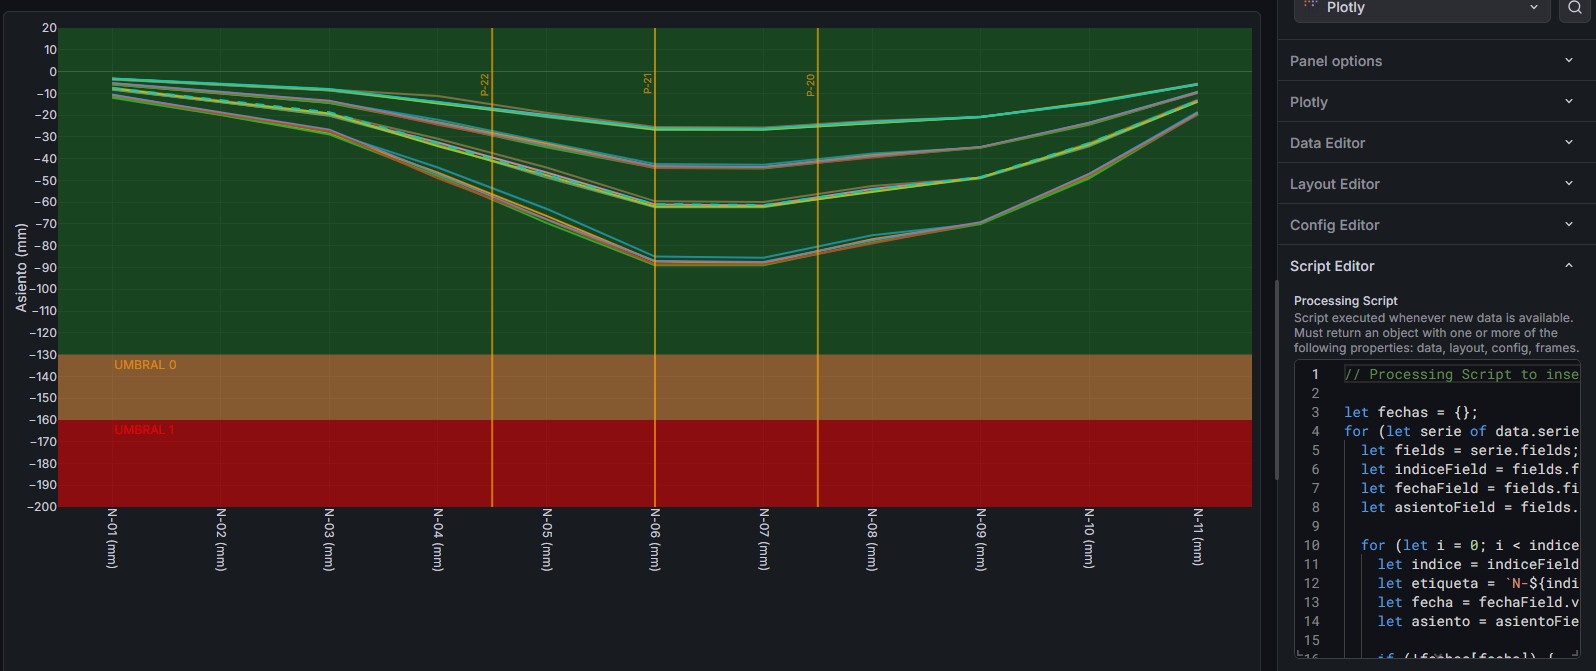
Developed an end-to-end streaming architecture using a mock OPC-UA server to generate sensor data. Configured Telegraf to ingest this data and write it to InfluxDB3, a high-performance time-series database. Created Grafana dashboards with custom JavaScript visualizations to monitor metrics in real-time and trigger alerts on anomalies.
Impact
Established a reliable framework for real-time IIoT monitoring, enabling sub-second data visibility and automated alerting. This architecture reduces the time to detect critical events and provides a scalable backend for storing historical sensor data.
Tech Stack Used
Key Challenges & Learnings
- Configuring Telegraf to correctly interface with the OPC-UA server and handle data types
- Setting up and optimizing InfluxDB3 for efficient time-series storage
- Implementing custom visualizations in Grafana using JavaScript for advanced plotting requirements
- Gained hands-on experience with the OPC-UA industrial communication protocol
- Learned to configure Telegraf as a versatile data collection agent
- Deepened understanding of InfluxDB3 architecture and its integration with Grafana for real-time dashboards
Screenshots